R tips: Generating figures as excel using R in terms of color
If you are used to use excel to generate figure in your research and you like the default colors, or if you're tired of choosing colors, you can use the one below in R.
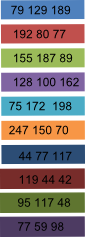
This is the default color assortment in Excel 2007.
In R, you can use it like this:
#R code
> color <- c(rgb(79,129,189,max = 255), rgb(192,80,77,max = 255), rgb(155,187,89,max = 255), rgb(128,100,162,max=255), rgb(75,172,198,max=255), rgb(247,150,70,max=255), rgb(44,77,117,max=255), rgb(119,44,42,max=255), rgb(95,117,48,max=255), rgb(77,59,98,max=255))
> plot(1:10, 1:10, col=color,pch=20,cex=6)

This is the default color assortment in Excel 2007.

In R, you can use it like this:
#R code
> color <- c(rgb(79,129,189,max = 255), rgb(192,80,77,max = 255), rgb(155,187,89,max = 255), rgb(128,100,162,max=255), rgb(75,172,198,max=255), rgb(247,150,70,max=255), rgb(44,77,117,max=255), rgb(119,44,42,max=255), rgb(95,117,48,max=255), rgb(77,59,98,max=255))
> plot(1:10, 1:10, col=color,pch=20,cex=6)


Comments
Post a Comment